Body text
Anthropogenic activities, by far the largest source of NOx into the atmosphere, induce a weekly cycle of NO2 abundances in and around cities. Here we use NO2 column data from two nadir-viewing satellite sensors:
- the Ozone Monitoring Instrument (OMI) launched in July 2004
- the high-resolution Tropospheric Monitoring Instrument (TROPOMI), single payload of the Sentinel-5 Precursor (S-5P) launched in October 2017
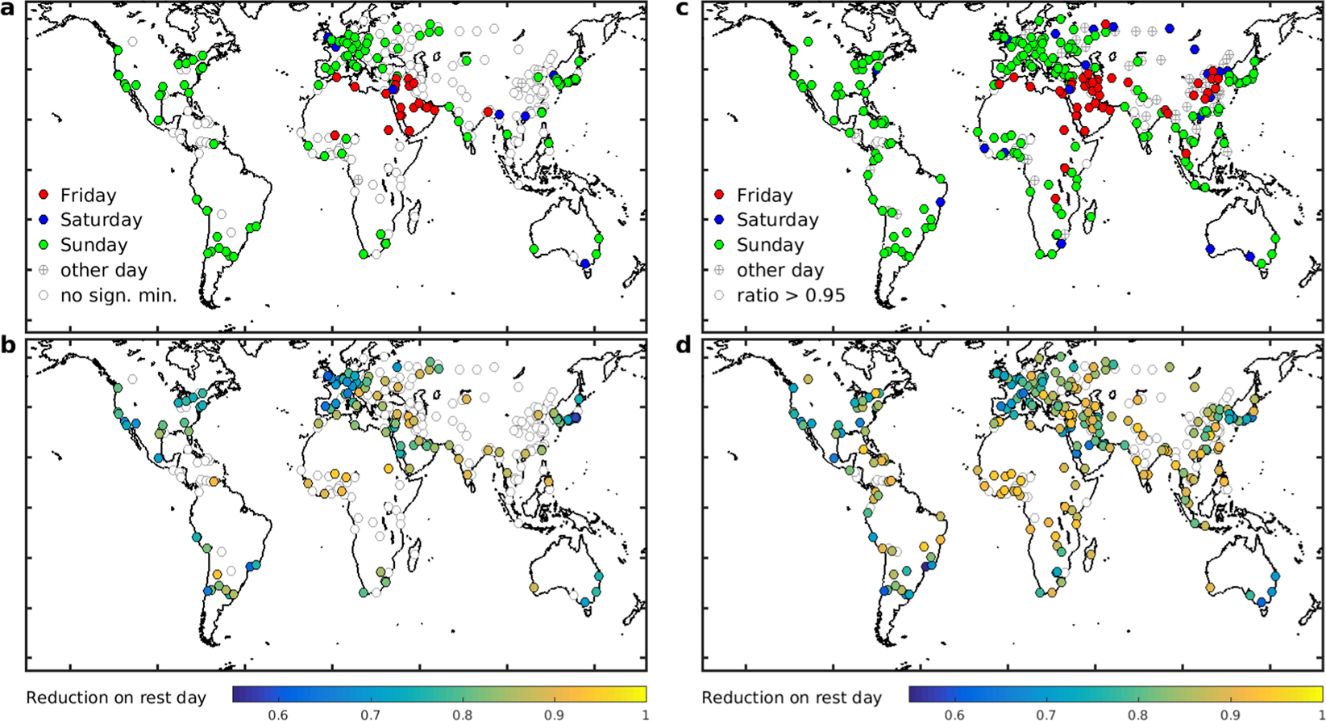
Detailed analysis of the 2005–2017 OMI dataset reveals significant weekly cycles in 115 of the 274 cities considered. These results are corroborated by a full year of high-resolution TROPOMI NO2 observations (cf. Figure 1).
Observed and modelled changes in weekly cycles
The OMI dataset makes possible to identify trends in the weekly cycle resulting from NOx emissions changes. The data show a clear weakening of the weekly cycle over European and U.S. cities, an evolution attributed to the decline in anthropogenic emissions and the resulting growing importance of background NO2. The opposite tendency is observed in regions undergoing rapid emission growth.
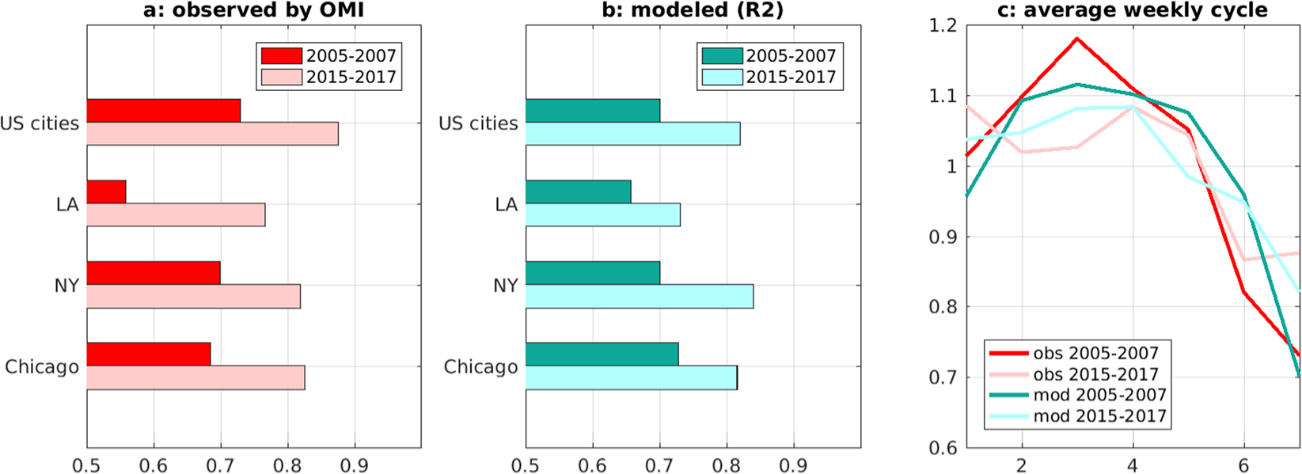
Multiyear simulations over the U.S. and the Middle East using the MAGRITTEv1.1 chemistry-transport model succeed in capturing the observed weekly cycles over the largest cities, as well as the observed long-term trends in the weekly cycle. Over the U.S., the NOx emission decline over 2005–2017 has led to a significant weakening of the weekly cycle, as shown by the comparison of Sunday-to-week column ratios for the periods 2005–2007 and 2015–2017 (cf. Figure 2).
On average for all U.S. cities, the ratio has increased by 22% (from 0.72 to 0.88), in excellent agreement with the model prediction (+20%). This result reflects the non-linear relationship between anthropogenic NOx emissions and NO2 columns, due to the contribution of natural emissions (either local or imported) to the NO2 column above cities, and to chemical feedbacks of the NOx-OH system.
Reference:
Stavrakou, T., Müller, J., Bauwens, M., Boersma, K.F., and Van Geffen, J. (2020). Satellite evidence for changes in the NO₂ weekly cycle over large cities. Scientific Reports, 10, A10066. https://doi.org/10.1038/s41598-020-66891-0 ![]()