This spring, the Arctic was marked by what may be the largest hole in the ozone layer ever recorded over the North Pole. The ozone hole is a common seasonal phenomenon observed yearly over the South Pole areas (Antarctica) due to the release of chlorofluorocarbons (CFCs) in the atmosphere from human activity. Ozone holes over the Arctic, however, are rarer. Since the start of satellite observations over this region in 1978, only one Arctic ozone hole has formed above the North Pole before. This occurred in 2011 and it was significantly smaller than the hole seen now. Unusual meteorological conditions are responsible for this year’s exceptional ozone hole at the North Pole.
Ozone hole formation
The ozone hole forms in the lower stratosphere, at an altitude roughly between 15 and 30 km. When the polar night falls, a “vortex” forms that isolates polar air masses from more southern air masses. The temperature decreases, allowing the activation of “inactive” chlorine reservoirs.
At the end of winter, the return of sunlight breaks down the active chlorine reservoir, releasing chlorine atoms that destroy ozone (these are called catalytic reactions). This is only possible if the vortex is maintained after the return of sunlight, which is extremely rare at the North Pole.
The source of stratospheric chlorine is primarily human activity. These are the CFCs whose industrial production was stopped several decades ago to protect the ozone layer. Nevertheless, the lifetime of CFCs is very long and the ozone hole phenomenon (at least at the South Pole) is expected to continue for up to around 2060.
Origin of the exceptional Arctic ozone hole 2020
Let’s have a closer look at what happened this year, in 2020, and what created the right circumstances for this exceptional ozone hole to happen.
The following animation shows the evolution of three chemicals, between December and April, in the lower stratosphere. These substances are ozone (O3), the active chlorine reservoirs (ClOx, which is a combination of ClO and Cl2O2), and nitrous oxide N2O. The latter is an indicator of the intensity of the polar vortex. The animation compares this year’s ozone hole over the North Pole area (2020) with the only Arctic ozone hole ever observed before (2011) as well as with what may be considered a “normal” year (2017).
It additionally shows the time series of lower stratospheric columns of O3 and ClOx (i.e. columns for altitudes between 10 and 100 hPa and for the latitude zone 60°-90°N), as well as the volume of the polar vortex in the lower stratosphere.
Watch the full animation on ozone, active chlorine and nitrous oxide in the lower stratosphere here.
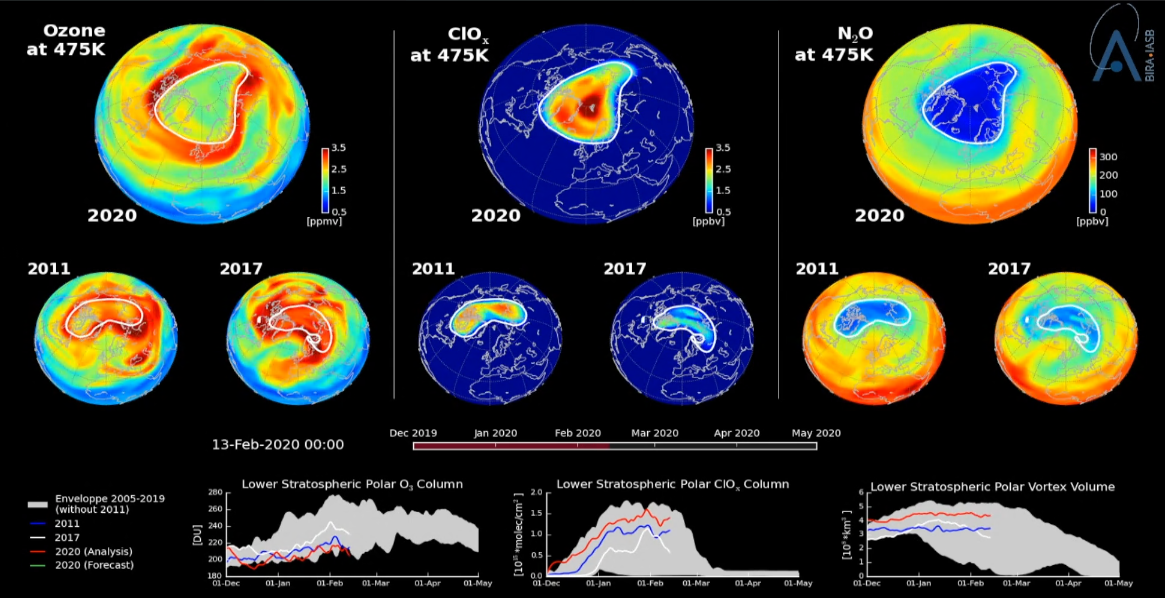
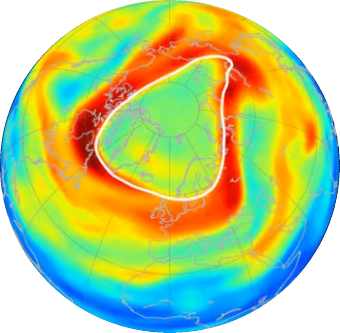
Left: ozone (O3) at an altitude where the ozone concentration is maximum (475K potential temperature height);
Center: active chlorine (ClOx), which will supply the ozone-destroying chlorine atoms at the end of the polar night;
Right: nitrous oxide (N2O), an excellent meteorological indicator showing how isolated the polar vortex is (area in blue) from the more southern air masses (area in green-yellow-red).
Time series
Left: The bottom graph shows the evolution of the thickness of the ozone layer for 2011 (blue line), 2017 (white), 2020 (red and green, for the analysis and forecast respectively), as well as the range of values for all the years 2004-2019 apart from 2011 (grey zone).
Center: same for ClOx.
Right: the volume of the polar vortex at an altitude where the ozone concentration is maximum (475 K).
What can we conclude from this animation?
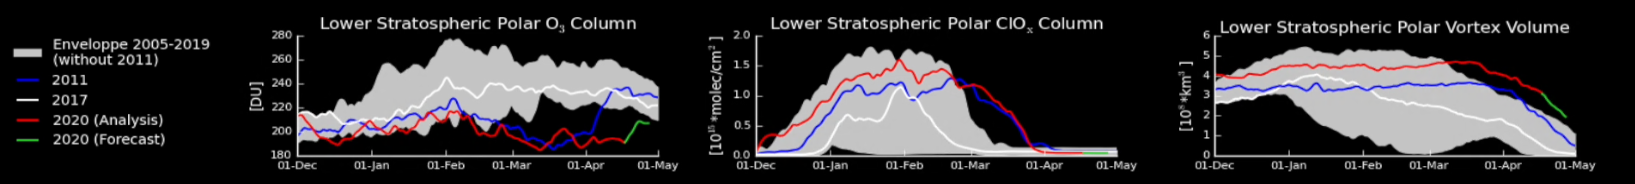
The ozone columns over the Arctic have decreased to what is normally considered ‘ozone hole levels’ (less than 220 Dobson Units) since 14 March 2020, over a maximal area of less than 1 million km2 (roughly three times the size of Greenland, a mere 4 to 5% of a “normal” Antarctic ozone hole). While in 2011, the ozone hole started to recover early April, the forecasts predict the onset of ozone recovery only for the coming days.
Compared to previous years, the chlorine activation in 2020 is not so exceptional. However, while in general the vortex weakens before the end of the polar night, the 2020 vortex lasts well after it, which means that the chlorine had more time to destroy ozone. The persistence of the vortex additionally prevented the mixing of ozone-depleted polar air masses with mid-latitude air masses.
In conclusion: a stable, long-lasting vortex, persistent freezing temperatures and a substantial amount of chlorine in the stratosphere made that the chlorine had time to effectively destroy the ozone. If one of these conditions wouldn’t have been fulfilled, we wouldn't have had such a deep O3 hole.
Consequences for life on Earth
In general, the ozone layer absorbs a large part of the Sun's harmful ultraviolet rays, which makes life on Earth possible. However, the small amounts of ozone observed this winter at the North Pole were not low enough to create a significant health or environmental hazard. People living in the exposed polar regions had to apply sunscreen to avoid sunburn.
Contact
- Quentin Errera, leader of the “Stratospheric modelling” group at BIRA-IASB
- E-mail: quentin (dot) errera (at) aeronomie (dot) be
- Simon Chabrillat, leader of the “Chemical weather” group at BIRA-IASB
- E-mail: simon (dot) chabrillat (at) aeronomie (dot) be
- Karolien Lefever, head of the Communication Cell at BIRA-IASB
- E-mail: karolien (dot) lefever (at) aeronomie (dot) be
Youtube and Vimeo
You can find the Arctic ozone hole video animations with explanations on Youtube and Vimeo.
Technical background and acknowledgments
- The ozone, ClOx (ClO + 2 Cl2O2) and N2O fields are produced by the Belgian Assimilation System of Chemical ObsErvations (BASCOE). The analyses are constrained by O3, ClO and N2O observations by the MLS (Microwave Limb Sounder) instrument onboard NASA’s Aura satellite.
- For 2004-2019, we used the values from the BASCOE Reanalysis of Aura MLS, version 2 (BRAM2, Errera et al., ACP, 2019)
- For 2020, we used the BASCOE NRT products (Lefever et al., ACP, 2015, www.copernicus-stratosphere.eu/)
- The meteorological analyses and forecasts are provided by the European Centre for Medium-Range Weather Forecasting (ECMWF):
- For 2004-2019, we used the ECMWF ERA-Interim reanalysis
- For 2020, we used the ECMWF operational analysis and forecast (see www.ecmwf.int)
- The maps are shown at 475K potential temperature height, which is in the lower stratosphere, at an altitude where the ozone depletion is strongest.
- The vortex edge corresponds to the isoline of the scale Potential Vorticity (sPV) equal to 1.7 104 s-1 (Manney et al., JGR, 2011).