Body text
Connection between dust storms, water vapour and the evolution of Mars’ atmosphere
Surface features on Mars indicate that liquid water was present on Mars in the past. Recent studies suggest that global dust storms effectively transport water vapour from the near surface to the middle atmosphere of Mars. This behaviour is of interest in terms of the evolution of the planet, as water molecules at greater heights are more readily dissociated by sunlight and lost into space. The study of this process can tell us more about how the atmosphere of Mars may have changed over billions of years.
TGO/NOMAD observes high altitude water
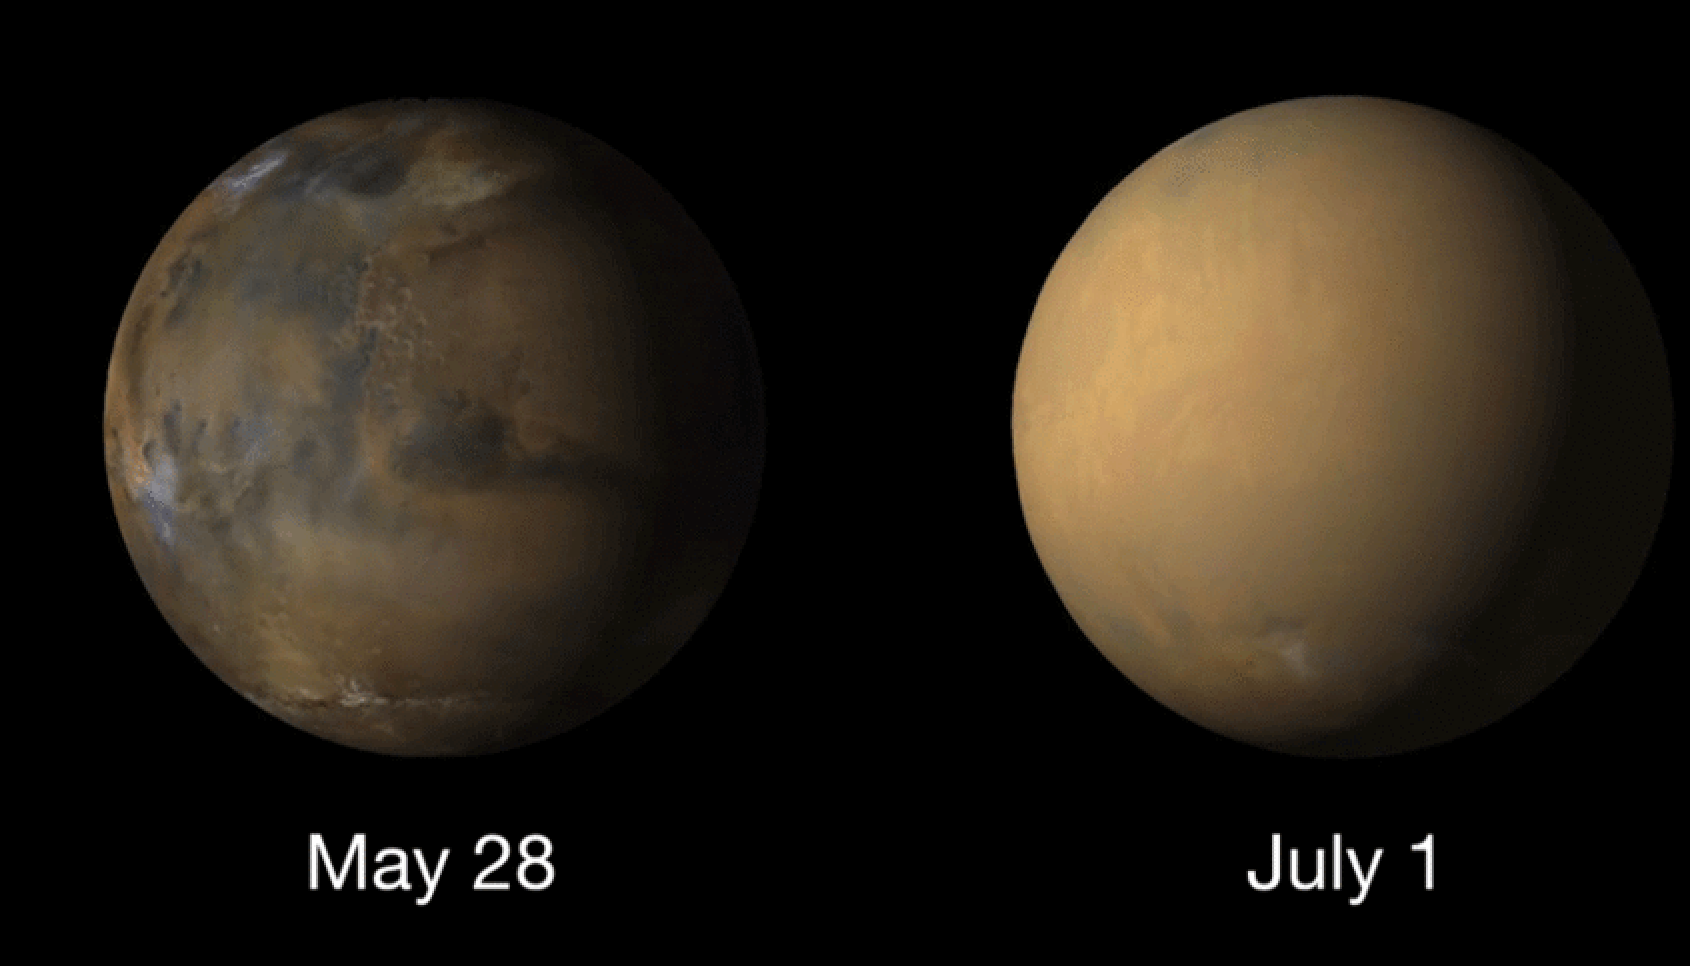
In June to September 2018 and January 2019, a strong global dust storm and a regional storm occurred on Mars, respectively. We analysed the measurements taken at these periods by the NOMAD instrument onboard TGO currently in orbit around Mars. The objective was to investigate altitude profiles of water vapour in the martian atmosphere measured during the dust storms.
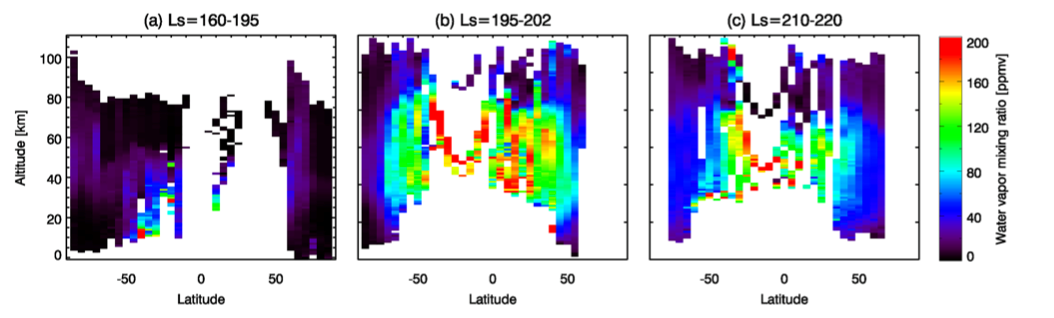
A significant increase of water vapour abundance in the middle atmosphere (40–100 km) was identified during the global dust storm - water vapour reached very high altitudes, up to 100 km. A noticeable increase was seen during the regional dust storm as well. The TGO-NOMAD observations have provided an unprecedented view of this important aspect of the Mars atmosphere.
Using numerical modelling to explain the observations
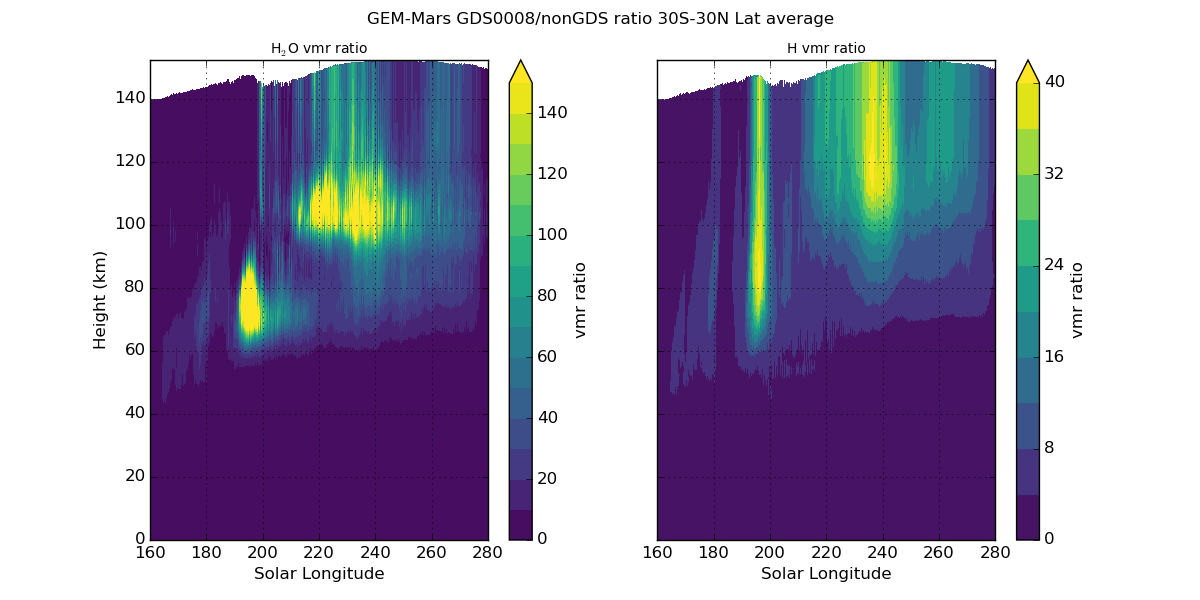
Using a three‐dimensional numerical model of the Mars atmosphere (GEM-Mars), we found that when dust from the storm is transported up to levels above ~40 km, it warms the atmosphere due to solar absorption. This in turn prevents ice clouds from forming at heights of 40–60 km and allows more water vapour to ascend to greater heights in the atmosphere.
We performed several simulations, varying the vertical distribution of the dust in the model and found that the formation of ice clouds is very sensitive to this. Numerical modelling experiments like these are crucial for the interpretation and understanding of the observations made by NOMAD.
References
-
Aoki, S., Vandaele, A.C., Daerden, F., Villanueva, G.L., Liuzzi, G., Thomas, I.R., Erwin, J.T., Trompet, L., Robert, S., Neary, L., Viscardy, S., Clancy, R.T., Smith, M.D., Lopez‐Valverde, M.A., Hill, B., Ristic, B., Patel, M.R., Bellucci, G., Lopez‐Moreno, J.-J., and the NOMAD team. (2019). Water Vapor Vertical Profiles on Mars in Dust Storms Observed by TGO/NOMAD. Journal of Geophysical Research: Planets, 124(12), 3482-3497. https://doi.org/10.1029/2019JE006109
-
Neary, L., Daerden, F., Aoki, S., Whiteway, J., Clancy, R.T., Smith, M., Viscardy, S., Erwin, J.T., Thomas, I.R., Villanueva, G., Liuzzi, G., Crismani, M., Wolff, M., Lewis, S.R., Holmes, J.A., Patel, M.R., Giuranna, M., Depiesse, C., Piccialli, A., Robert, S., Trompet, L., Willame, Y., Ristic, B., and Vandaele, A.C. (2020). Explanation for the Increase in High‐Altitude Water on Mars Observed by NOMAD During the 2018 Global Dust Storm. Geophysical Research Letters, 47(7), e2019GL084354. https://doi.org/10.1029/2019GL084354 .