Anthropogenic nature of emission sources
The presence of a weekly cycle in the abundance of an atmospheric constituent is a typical fingerprint for the anthropogenic nature of its emission sources. However, while ammonia (NH3) is mainly emitted by human activities, a weekly cycle has never been detected in its abundances at large scale.
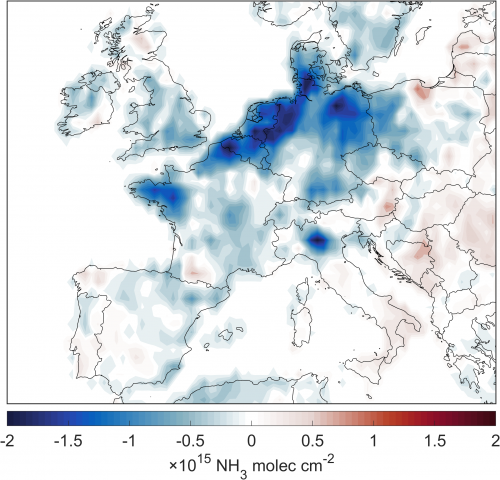
Based on the NH3 total columns measured by the IASI satellite sounder, we have exposed for the first time the presence of a weekend effect over the main agricultural source regions in Europe. It is most pronounced in north-western Europe (Belgium, the Netherlands and northwest Germany) and Brittany, but is also present to a lesser extent in the Po and Ebro Valleys.
The main weekly temporal pattern consists of decreasing abundances starting on Friday-Saturday, minima observed on Sunday–Monday, and a building up of the abundances during the other week days.
Emissions from manure management
A decrease of 15% relative to the weekly mean is seen on Sunday–Monday observations in north-western Europe (cf. Figure 2). Comparison with emission inventories suggests that this reduction is due to a weekly cycle in the emissions from manure management.
Fertilization of the fields therefore preferentially occurs during week days. This is consistent with Sunday being the traditional rest day in Europe but also with regulations on manure spreading which is prohibited on Sunday in several regions such as Flanders (Belgium) and Brittany (France).
Ground-based verification
The weekly cycle reported by IASI is confirmed by in situ NH3 concentration data from the National Air Quality Monitoring Network in the Netherlands, which provides hourly measurements at eight sites spread over the country. Daily variations over the week reveal a marked weekly cycle for each individual site, with minima also observed on Sunday-Monday.
Weekly cycle seasonality
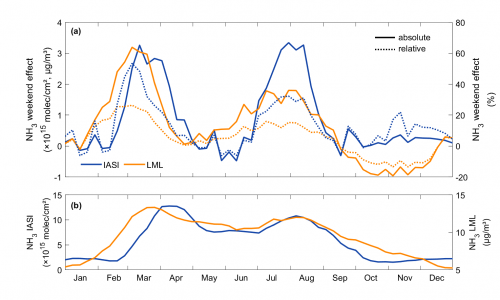
The identified weekend effect presents a strong seasonal variability, with two peaks, one in spring and one in summer, coinciding with the two main (manure) fertilization periods (Figure 3). In spring, a reduction on Sunday–Monday up to 53 and 26% is found in the NH3 satellite columns and in situ concentrations, respectively, as fertilization largely drives NH3 abundances at this time of the year.
Future satellite missions, offering hourly measurements, will allow for an even better characterisation of short temporal scale changes in NH3 abundances. This information is crucial to better represent the NH3 atmospheric evolution and better assess related impacts on human and environment health.
Reference
Van Damme, M., Clarisse, L., Stavrakou, T., Wichink Kruit, R., Sellekaerts, L., Viatte, C., Clerbaux, C. and Coheur, P.-F. On the weekly cycle of atmospheric ammonia over European agricultural hotspots, Scientific Reports, 12, 12327, https://doi.org/10.1038/s41598-022-15836-w, 2022.


