From formaldehyde observations to emission trends
Anthropogenic non-methane volatile organic compounds (AVOCs) are key atmospheric constituents affecting air quality and climate through their role in the formation of ozone and organic aerosols. Emissions of AVOCs are significant in urban and industrialized areas and their major sources include fossil fuel, industrial processes, solvent use, and road transport.
The derivation of AVOC emissions and their trends using satellite observations of formaldehyde (HCHO) is challenging due to the generally weak HCHO signal from anthropogenic sources. This work shows that emission trends can be accurately monitored above many large cities in Asia, based on HCHO column data from the OMI satellite instrument spanning 15 years, from 2005 to 2019.
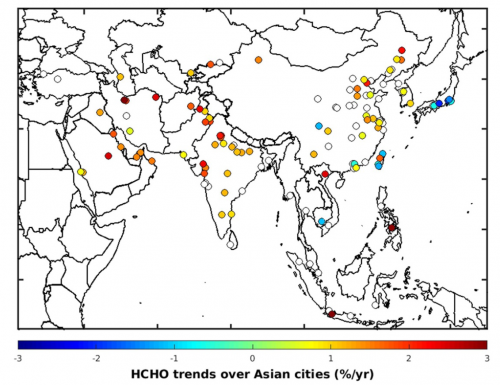
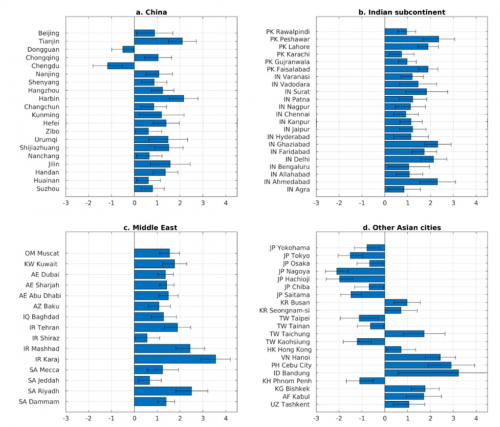
Of the 133 studied cities, significant trends are found for 77 cities. Positive HCHO trends are found for most urban areas (cf. Figure 1 and Figure 2).
- The observed trends over China are relatively weak and mostly positive.
- In the Indian subcontinent, strong positive trends are observed, estimated on average at 1.4% per year.
- Positive trends are also found over the Middle East and central Asia reaching up to 3.6% per year (Karaj, Iran).
- Significant negative trends are found in Japan, estimated on average at −1.5% per year for all considered cities.
- In Taiwan, the HCHO trends are also mostly negative.
Contrasting NO2 and HCHO trends
Since Chinese VOC regulations were only recently implemented, HCHO trends calculated between 2005 and 2018 do not yet validate these efforts. Nevertheless, the effect of AVOC regulations is clearly seen in two important megacities (Dongguan and Chengdu). In Japan and Taiwan, negative trends are found, demonstrating that air quality regulations targeting AVOC emissions are effective in these countries.
The contrast between the observed evolution of NO2 and HCHO columns over Asian cities (cf. Figure 1 and Figure 3) illustrates well that emission controls targeting NOx sources have little or no impact on AVOC emissions, in particular over China, as the major sources of NOx and AVOC are markedly different.
The important differences between HCHO and NO2 trends highlight that legislation targeting specifically VOC emissions are needed to improve air quality. The limited number of initiatives to regulate AVOC emissions is made clear by the detected positive HCHO column trends in many Asian countries, contrasting with the weaker, or even negative trends in countries were policy measures are in place.
Reference
Bauwens, M., B. Verreyken, T. Stavrakou, J.-F. Müller and I. De Smedt: Spaceborne evidence for significant anthropogenic VOC trends in Asian cities over 2005-2019. Environ. Res. Lett. 17, 015008, https://doi.org/10.1088/1748-9326/ac46eb, 2022.


