Nitrogen oxides (NOx = NO + NO2) negatively affect human health, the ecosystem and further react to produce secondary pollutants, most notably ozone, a greenhouse gas. NO2 mostly originates from human activity, namely transport (>50% of emissions), energy (26%) and industrial processes (14%). Monitoring activity at high-resolution scales can direct mitigation action towards the most polluting sectors.
Ground-based air quality stations throughout Belgium monitor pollutant concentrations on an hourly basis, while the sun-synchronous high-resolution TROPOspheric Monitoring Instrument (TROPOMI) measures vertical NO2 tropospheric columns on a daily basis. Both datasets observed high NO2 pollution near Antwerp, due to the scale and prevalence of the aforementioned sectors in this area.
TROPOMI was launched in November 2017. Since then, validation campaigns have shown the existence of positive biases in the NO2 columns obtained over highly polluted regions. Over Antwerp, TROPOMI NO2 retrievals were compared with column measurements at high temporal and spatial resolution obtained aboard an aircraft, equipped with a hyperspectral imager measuring NO2.
Simulation centered around Antwerp using bottom-up emissions
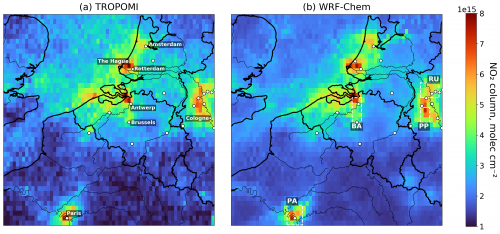
We set up a 100 x 100 km high-resolution WRF-Chem simulation centered around Antwerp using bottom-up emissions from the Flanders Environmental Agency, in 1km2 resolution. Model meteorology and chemistry were optimized through calibration tests against in situ and aircraft observations. We then used the model as a tool to improve the input emissions, more specifically, tuning the applied temporal profile and adjusting the magnitude over specific regions.
We noted that NOx emissions were underestimated over Brussels and Antwerp by 20%, over the Ruhr area by 13% and over Paris by 39%. The use of the adjusted emission fluxes in the model resulted in a very good agreement between the model and the observations (see Figure 1). Further work could focus on analysis of sector-specific underestimations.
Through intercomparison of model, aircraft and satellite NO2, we estimated the TROPOMI bias to be -10% over Antwerp, which is in the range of other independent validation results over high pollution zones. We highlighted the importance of accounting for the vertical sensitivity of the TROPOMI instrument. Finally, we conducted the analysis with an updated TROPOMI NO2 product, resulting in an insignificant bias over Antwerp.
Reference
Poraicu, C., Müller, J.-F., Stavrakou, T., Fonteyn, D., Tack, F., Deutsch, F., Laffineur, Q., Van Malderen, R., and Veldeman, N.: Cross-evaluating WRF-Chem v4.1.2, TROPOMI, APEX, and in situ NO2 measurements over Antwerp, Belgium, Geosci. Model Dev., 16, 479–508, https://doi.org/10.5194/gmd-16-479-2023, 2023.

