
Air pollution is recognised as being the fifth leading risk factor for mortality worldwide. Ambient air pollution contributes to about 5 million deaths globally – or one in ten deaths. In Europe, air pollution-related diseases claim one in eight deaths, according to the latest report of the European Environmental Agency. This brings air pollution in the spotlight of environmental problems of high societal relevance. Analyses based on satellite observations from the TROPOMI instrument, aboard the Copernicus Sentinel-5P satellite, launched in 2017, have been vital in tracking the evolution of air pollution across the world. TROPOMI is an instrument that detects atmospheric pollutants more accurately and at higher spatial resolution than ever before.
In 2020, satellite data has been widely used to monitor the changes in air quality that resulted from the COVID-19 measures that affected more than half of world’s population. Scientists from the Royal Belgian Institute for Space Aeronomy (BIRA-IASB) used satellite data from TROPOMI to explore the links between COVID-19 measures and the effects of nitrogen dioxide levels (NO2) since the beginning of the crisis until today. NO2 is released into the atmosphere from fuel combustion in vehicles, power plants, and industrial facilities, and can have significant impacts on human health – for instance by increasing respiratory problems.
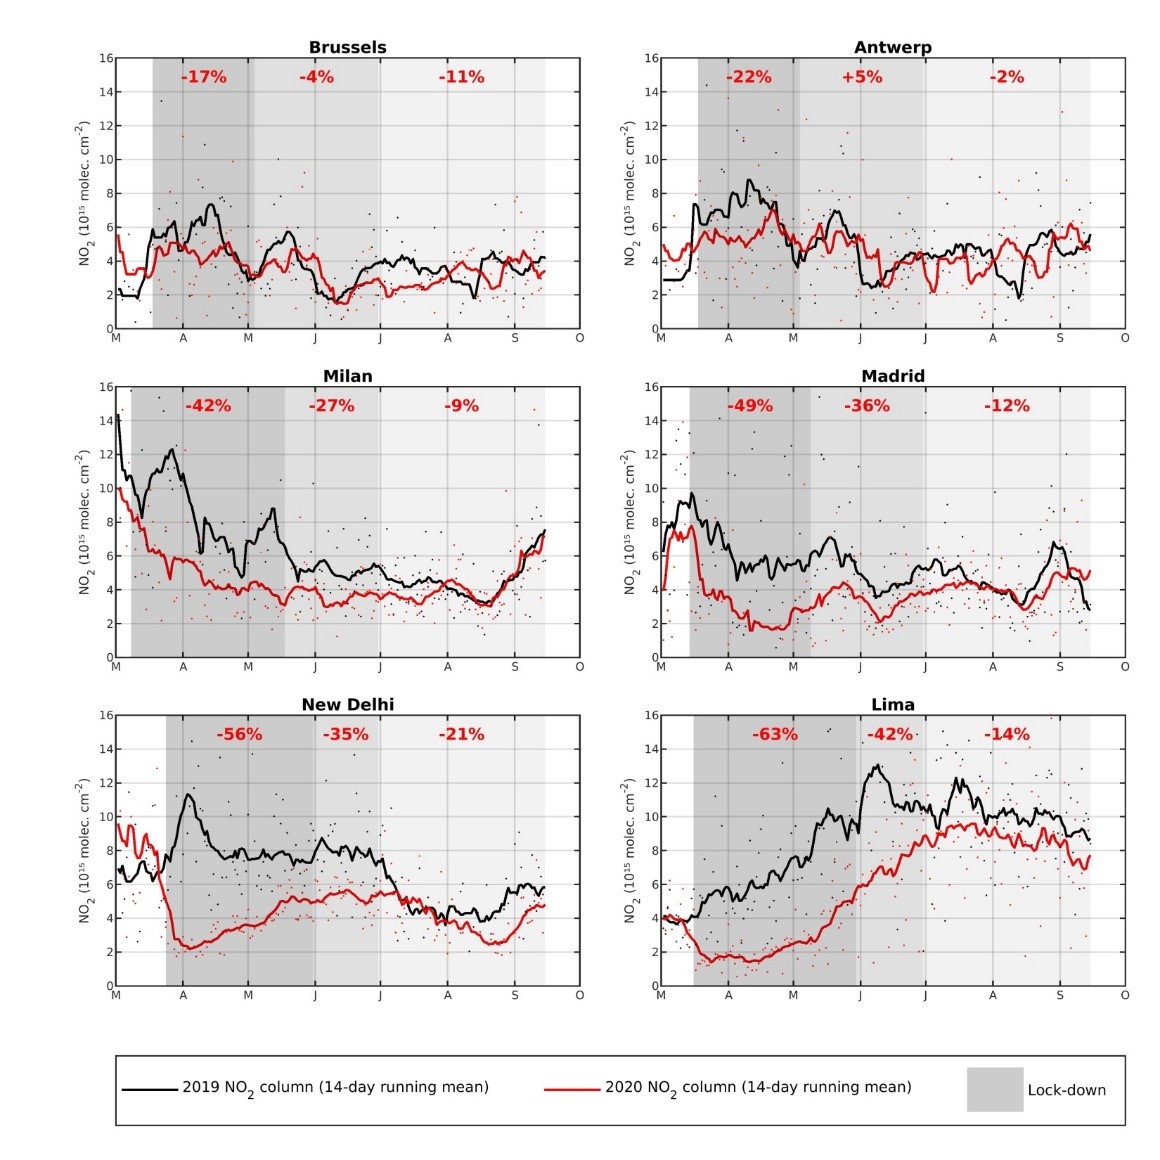
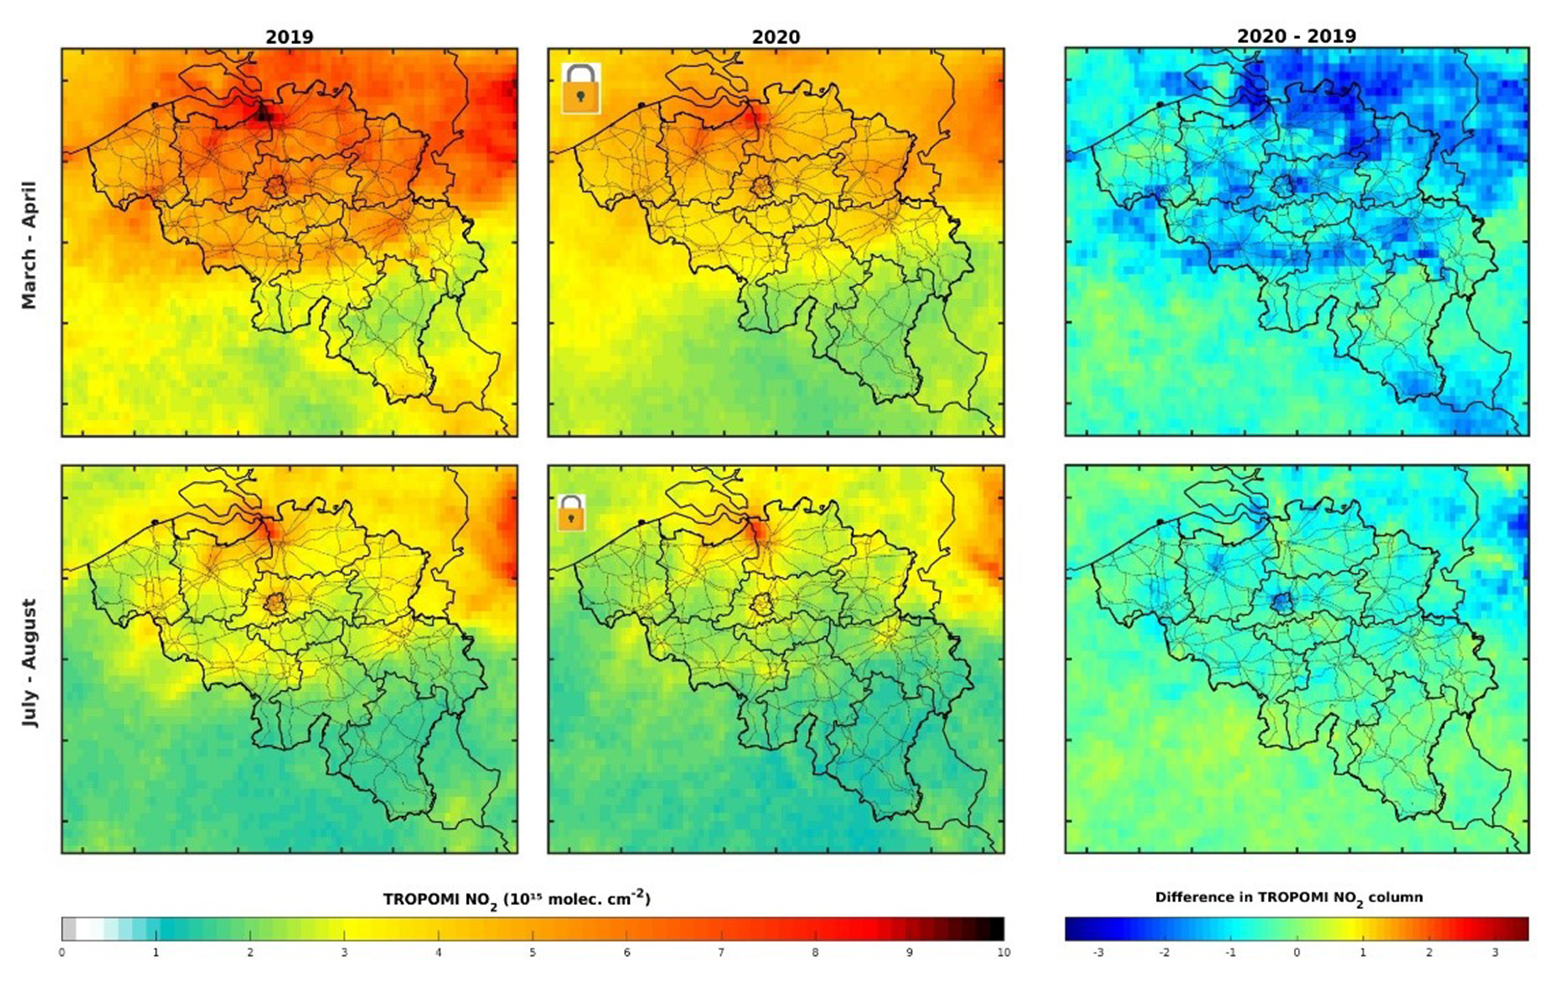
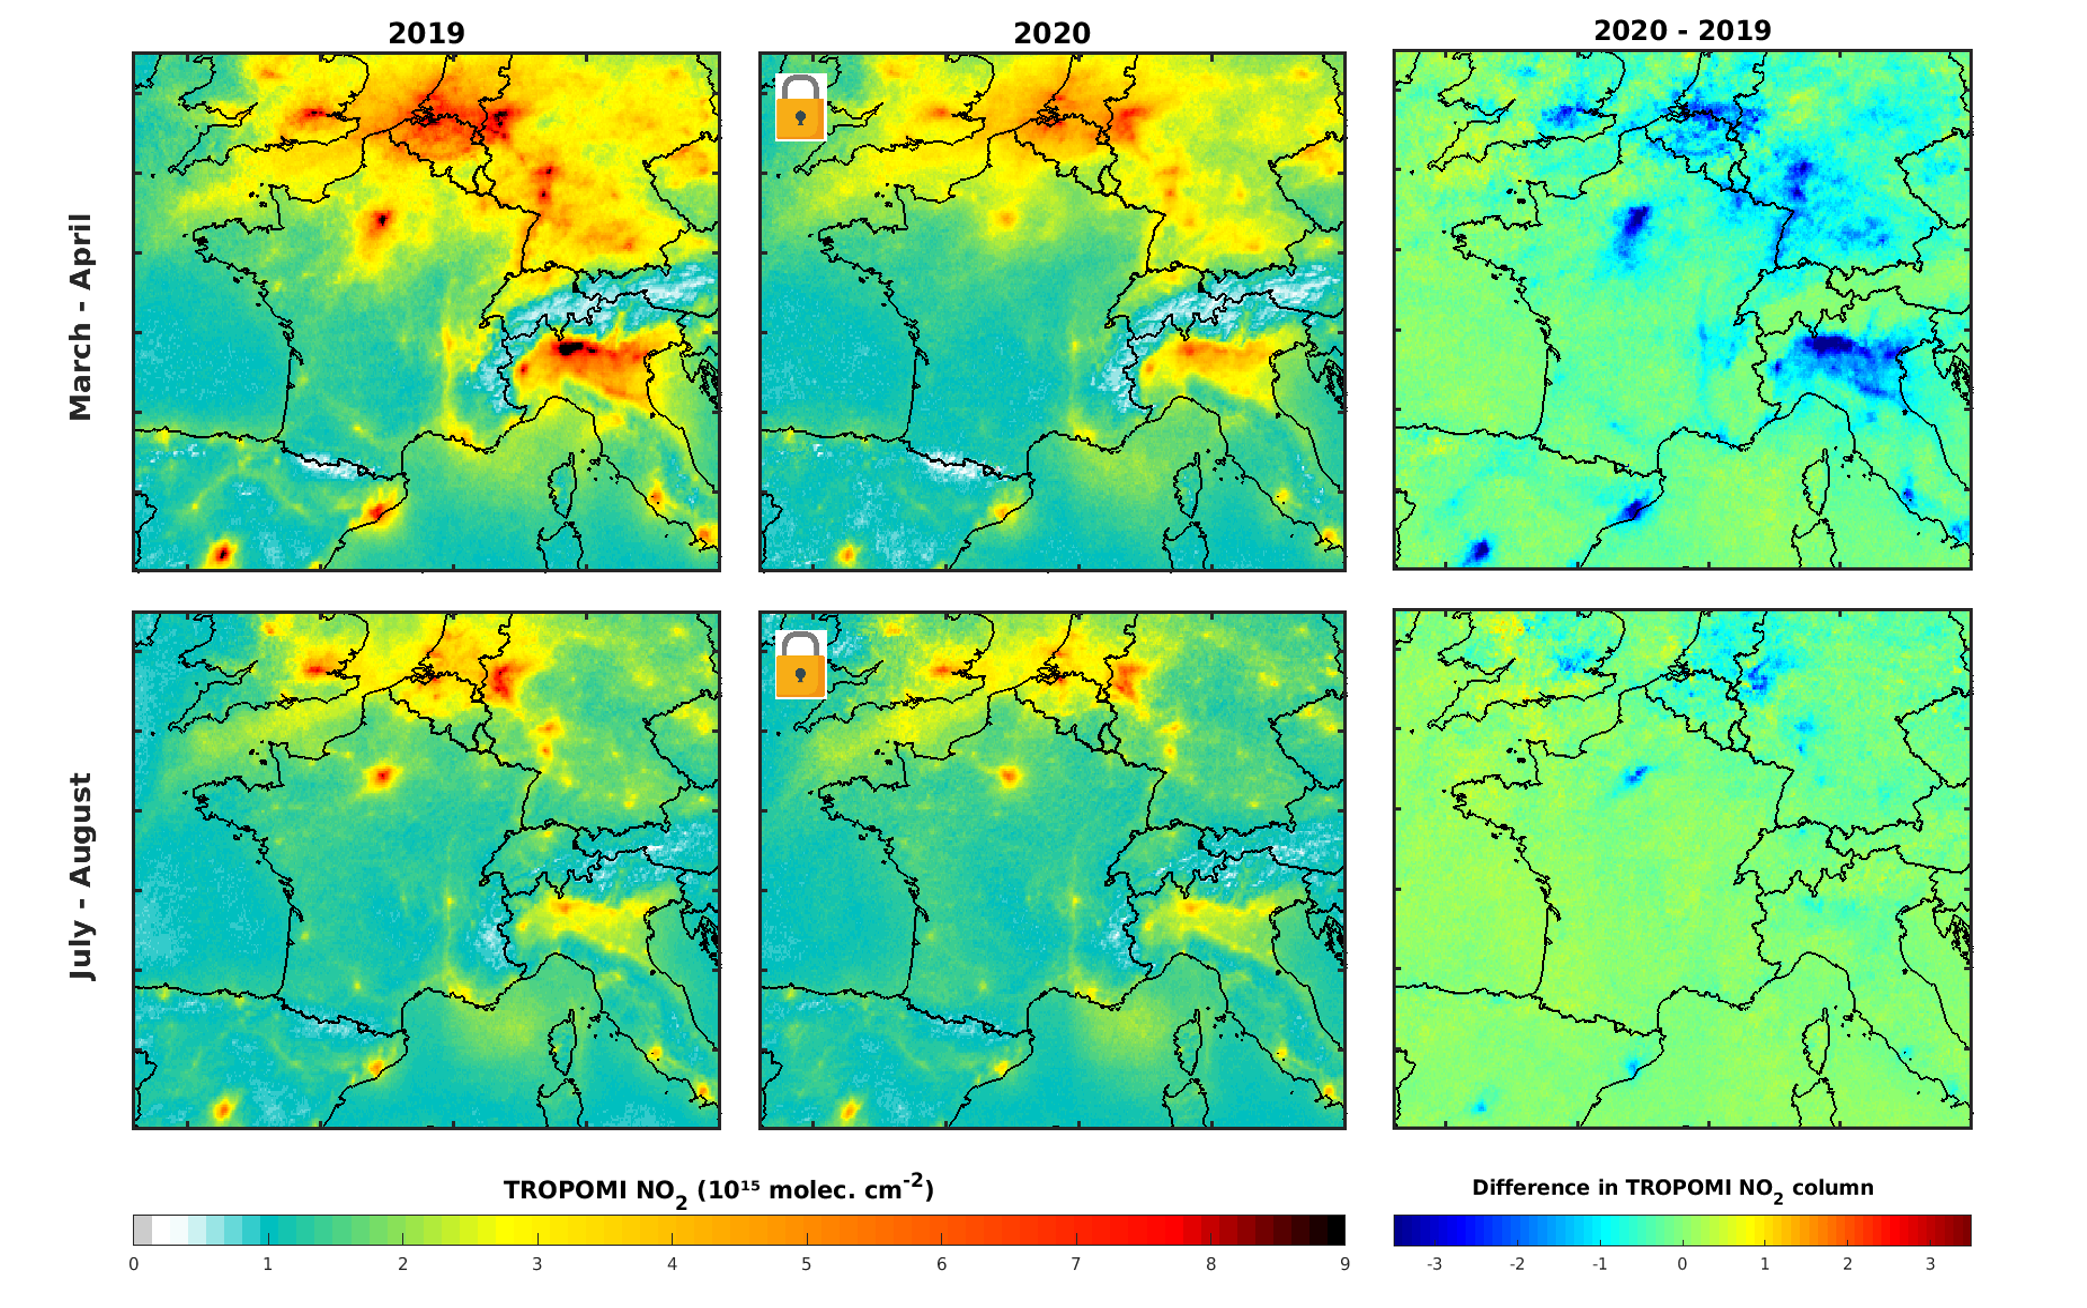
In March-April 2020, during the tight phase of the lockdowns in Europe, very strong reductions of satellite NO2 levels of the order of 40-50% were recorded in large cities of Spain, Italy and France, and moderate reductions of the order of 20% in Belgian cities, like Brussels and Antwerp (Figure 1 and 2). The main reason is well identified: vehicular traffic, one of the main sources of nitrogen oxides (NO and NO2), has been dramatically reduced during the first phase of the lockdown period. The analysis has also drawn attention to the remarkable technological progress made to measure pollution – satellite measurements made possible to monitor NO2 levels in near real-time globally.
The concentrations appear to return to near-normal levels in July-August 2020, due to the progressive relaxation of the lockdown measures, but are still lower by 10% over large cities where human activities have not yet fully resumed (Figure 1 and 2). In New Delhi and Lima, two megacities where public health measures to contain the pandemic were strongly enforced, the NO2 levels show a significant drop during the first phase of the lockdowns (Figure 3), and remain unusually low in July-August (20% below the 2019 levels). This indicates that the economy hasn’t returned to full capacity yet, despite the partial lifting of the restrictions.
The impact of meteorology on NO2 concentrations is also important and should not be overlooked. This is why it is necessary to analyse data over sufficiently long periods, in order to better estimate the impact of human activity. By comparing the monthly average of 2019 and 2020, we estimate an uncertainty on the COVID-19 induced reduction of around 15–20%. The decreases observed by the satellites and the decreases observed in measuring stations in different cities correspond well if we take into account their uncertainties and meteorological variability.
Contact
- Dr. Jenny Stavrakou, Atmospheric Scientist in the research group “Tropospheric Chemistry Modelling” - Email: trissevgeni (point) stavrakou (at) aeronomie (dot) be
- Dr. Maite Bauwens, Atmospheric Scientist in the research group “Tropospheric Chemistry Modelling” - Email: maite (point) bauwens (at) aeronomie (dot) be
- Dr. Karolien Lefever, Head of the Communication department – Email: karolien (dot) lefever (at) aeronomie (dot) be
Credits: Copernicus Sentinel-5P data (2019-2020).
Credits: Copernicus Sentinel-5P data (2019-2020).